Scope Ratings published the first report of a new quarterly series highlighting key data on NPL formation, based on the EBA’s Risk Dashboard. According to the latest EBA update, non-performing loans of EU/EEA banks continued to increase, reaching EUR 364.9 billion, in the fourth quarter of 2023.
But the increase (EUR 2.2 billion quarter-on-quarter; EUR 7.5 billion year-on-year) was barely noticeable in terms of the aggregate EU-wide NPL Ratio, which rose from 1.81% to 1.85%, close to its all-time low of 1.75% in March 2023. Although the increase was moderate, it still represents a reversal of the long-term trend of asset quality improvement seen in recent years.
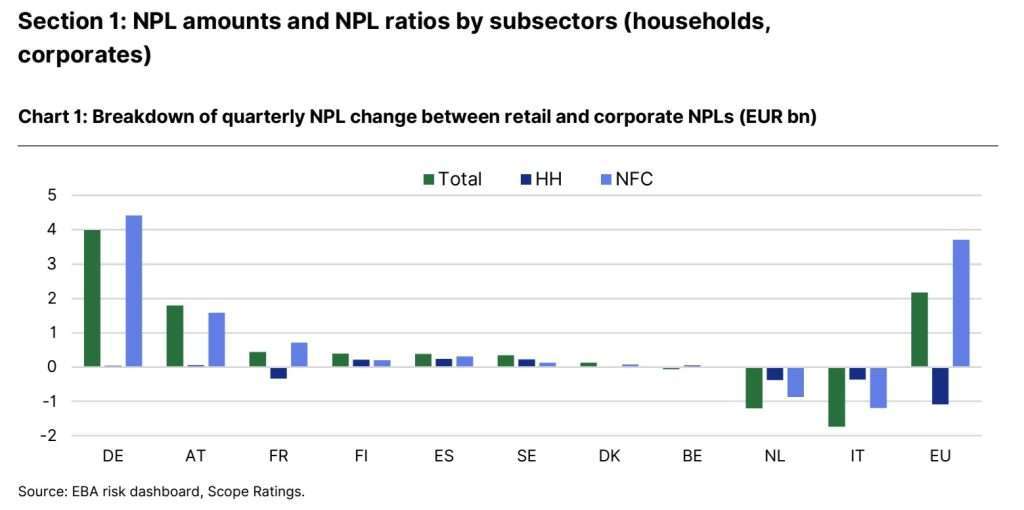
Although a modest economic recovery is expected in the second half of 2024, boosted by expected rate cuts, NPL formation is likely to continue to grow moderately this year due to a time lag. The situation varies between countries. Germany (+€4bn) and Austria (+€1.8bn) experienced the largest increases in NPLs in Q4 2023, although the deterioration has been contained and NPL ratios have returned to December 2019 levels (see Heatmap 1). This contrasts with continued improvements in the Netherlands (EUR -1.2bn) and Italy (EUR -1.7bn).
Overall, the increase in NPLs came mainly from corporate exposures . Retail exposures have so far weathered the current economic slowdown. The largest increase in retail NPL ratios was recorded in Finland and Sweden . In the Netherlands and Italy, the reduction in retail NPLs contributed to the overall improvement, suggesting that the trend may be more far-reaching.

It can be noted that the Netherlands recorded the largest increase in second-tier loans, although this is due to stricter classification criteria . There is no evidence of a general deterioration in NPL ratios by business sector or a concentration of problems in specific sectors. Exposure to real estate and construction has been a source of problem loans and remains an area of concern . The construction sector appears most frequently in the top 3 sectors with the highest NPL ratios across countries. NPL ratios in ‘Other EU/EEA countries’ are not substantially different, with a moderate increase in some countries (Luxembourg, Norway) and a continuous improvement in 11 countries, especially Greece, Ireland and Portugal.
